Misc Projects : RGB LED Color Calibration
This article documents some experiments with achieving accurate, characterized, color reproduction from Lamina Atlas RGB LED lamps.
During and since construction of my driving circuitry for RGB LEDs, I have wanted to characterize the color output, both (1) for my own edification, and (2) to facilitate calibration of the color output to a defined color space, such as the sRGB of a typical computer monitor.
I recently leased an X-rite Colormunki spectrophotometer suitable for this task. The following describes the data I was able to gather, and how I've used it to calibrate for accurate color reproduction from the lamps.
Introduction to Color
I've learned quite a lot about color, perception, and color spaces through this process, though am by no means an authority in those subjects. So, allow me to disclaim that some of the discussion in this article is fast-and-loose from a perspective of color theory. I mean to limit the scope here to the results I've obtained, more than to write a comprehensive document about color.
Here are a few excellent references for background:
Color FAQ
Wikipedia: Color Spaces
Wikipedia: CIE 1931 Color Space
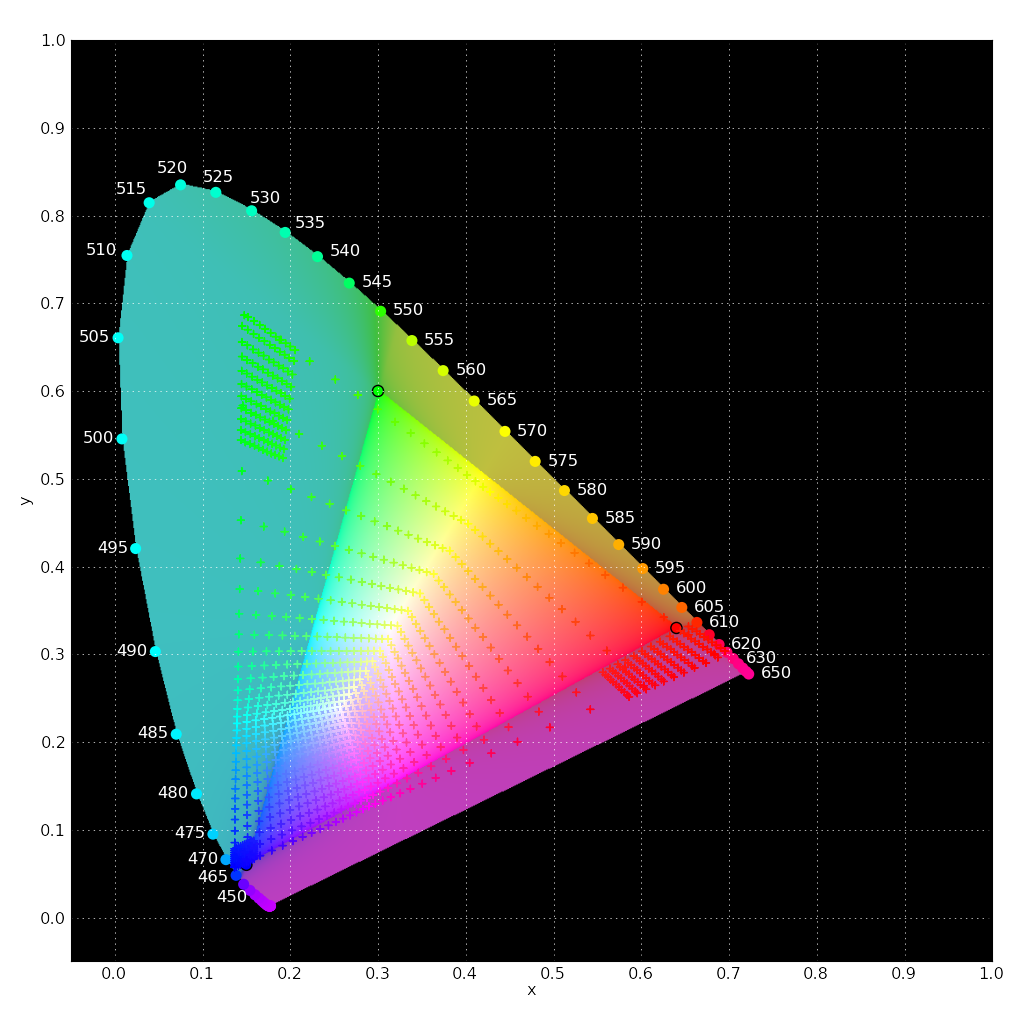
A mild familiarity with CIE xyY space will help with much of the following. Derivation aside, the premise is to define a way of describing a color in terms of brightness and chromaticity, or what one would usually regard as the color itself. Brightness is described by (Y), a positive value. Chromaticity is decomposed into two coordinates, x, and y, each in the range zero to one. This system is derived from the response of the eye, though the variables do not directly correspond to response of the color receptors in the eye. The variables defining chromaticity may be considered to be arbitrary, if only one understands that a particular combination of x and y absolutely define a color. An approximate plot of this space is as follows:

The upper arc denotes the chromaticity of light of pure wavelengths (i.e., as in a rainbow). Interestingly, purple colors cannot be produced with a pure wavelength--a mixture of colors must be used. See Wikipedia: Line of Purples for more commentary.
There are a few notable properties of this image. First, not all numerical values of chromaticity are visible; human vision is limited to the shaded region. Second, your monitor, and the sRGB color space that this image is created within, is not capable of displaying, or representing, all visible colors. The triangle encompasses the set of colors (i.e., the gamut) possible with sRGB. The vertices are the specified chromaticities of the Red, Green, and Blue primaries. A mixture of these primaries can be used to produce a color inside the triangle--but it is impossible to generate a color outside of this triangle.
LED characterization
The expected center wavelengths for each color channel of the Lamina Atlas RGB LED are given in the specifications, along with a rough plot of the spectrum of each channel. This plot isn't entirely sufficient for my purposes. In particular, the intensity of each channel is presented relative to the maximum intensity of only that channel--not relative to the others. In addition, it would be nice if a table of values were given, rather than trying to interpret the curve from the provided plot. Further, I don't know how well my LEDs match the specifications, or how my driving circuitry might affect the output.
It is possible to approximate many parameters by eye, which is what I've done so far. In the end, this adds to a great deal of uncertainty, and doesn't appeal to my enthusiasm for precise, numerical measurements. I sought the more direct means of measuring the particular LEDs I have, using the driving circuity I've constructed.
Measurement
Three primary types of data were gathered. First, spectra of each channel were obtained, where the intensity of the light source is sampled at 3.33nm granularity between 360nm and 740nm, the approximate extents of human vision. This spectra effectively comprises the raw data from the spectrophotometer. Second, measurements of color in the CIE xyY space were taken. These can be derived by integrating the CIE color matching functions with the obtained spectrum. They are the measures that allow for achieving a correspondence with defined white points, and with other relative color spaces like sRGB. Finally, overall light intensity, in Lux, was measured.
spotread, from the open-source Argyll color management software was used for all measurements. This program communicates with the Colormunki device, and provides a means of obtaining the color information in CIE space, the light intensity in Lux, and a series of derived measurements such as color temperature and Color Rendering Index.
Example output is as follows:
Yxy: 12.038951 0.466255 0.413274
Ambient = 37.8 Lux, CCT = 2634K (Delta E 1.570767)
Closest Planckian temperature = 2618K (Delta E 0.921523)
Closest Daylight temperature  = 2418K (Delta E 1.773022)
Color Rendering Index (Ra) = 99.5
A small wrapper of Python code was written to help with automated sampling. This code is rough, checks few error conditions, and was written in the middle of a night, but you're welcome to it: calibrate_colormunki.py and wexpect.py (From Pexpect by Noah Spurrier).
All measurements were taken with a drive current of 500mA, at a distance of approximately 7-feet, centered in front of the Lamina 15-degree lense mounted on the LED EZ board. Intensity control is by PWM, using 12-bits of resolution available from a TLC5940. (See the 500mA LED driver for details of the electronics.)
Spectra
The following figure illustrates the spectrum of each channel, and the combined responses for given combinations of drive signal, as fractions of the "on" duty cycle time. The yellow and violet lines are the spectra of drive signals chosen to correspond to whitepoints at 5000K and 6500K temperatures.
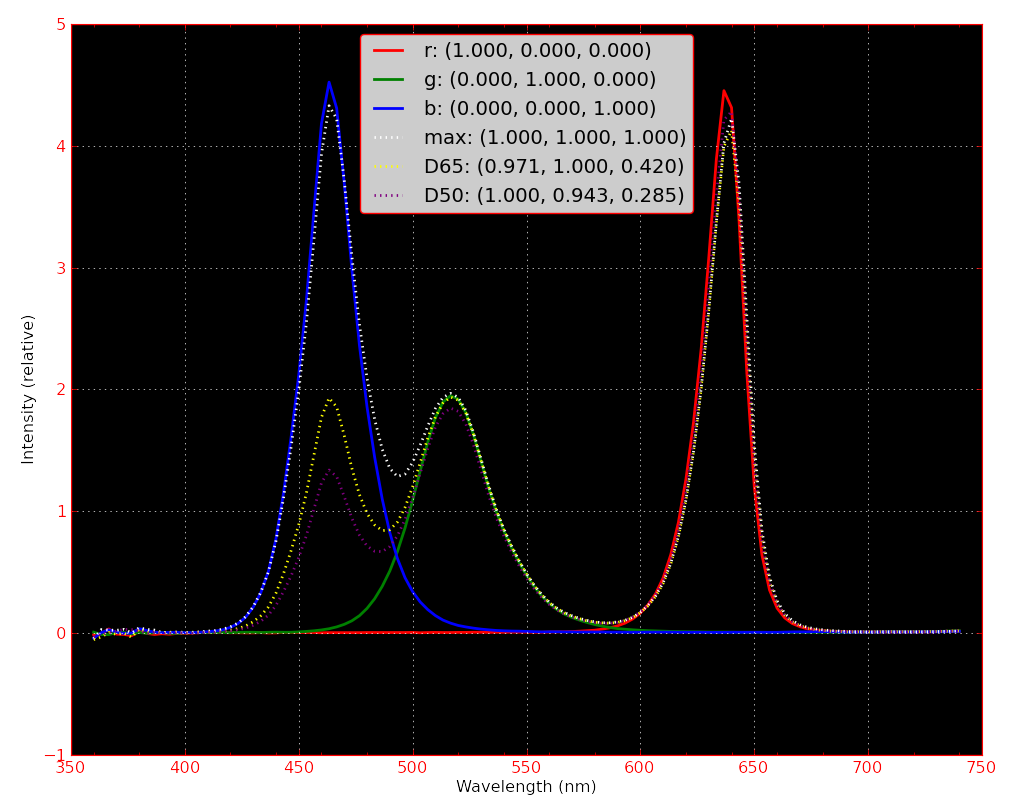
D50, or the 5000K whitepoint, is very standard for calibrated lighting. Emissive displays and projectors are typically set for 6500K, which appears similar by eye to the D50 light source when it is reflected from a surface. Under 5000K light, objects like white paper fluoresce, effectively behaving as if a higher temperature light source were used.
It is clear that this spectra is very uneven, for use in broad-spectrum lighting. A correct D50 or D65 light would be relatively flat, sloping downward at higher wavelengths. This is relevant to light reflected from colored objects. While the light itself may look a particular color, which is entirely dependent upon its position in CIE x-y space, the appearance of an object depends upon what is reflected from it. If, say, an orange object reflected most light near 590nm (orange), then it follows that if the illuminating source has a spectrum with very low intensity near 590nm, that the reflected light could not contain this wavelength, and the object would not appear orange. This situation is exactly the case here: I am unable to differentiate between the shades of orange and red used on my rubix cube. (No, this doesn't change my inability to solve it, though it surely doesn't help.)Of course, there exist measures to capture this property. One common metric is the Color Rendering Index. In terms of this, these LEDs yield only 19.4/100 at the D50 point, and 23.9/100 at D65.
It is possible to buy RGBA LEDs, which have an additional amber emitter, right at 580-590nm. This would help dramatically.
Sampling the space of all drive signals
Ideally, knowing the spectrum of each of the RGB emitters in the LED would be enough to accurately calibrate for any choice of color.
To gather as much data as possible while I had the spectrophotometer, I simply sampled the space of all RxGxB drive signals. The following figure illustrates the values of chromaticity achievable with the Atlas LED. Crosses denote the sampled points. The plotted color of each cross is the color of the RGB drive signal (i.e., not the color of that point in x-y CIE space), in sRGB space.
The primary observation from this plot is that the gamut of these LEDs is considerably larger than sRGB; the three primaries, especially green, are well outside the sRGB triangle. Note that the sRGB green primary lies just outside of the measured LED gamut, so the full sRGB space cannot be reproduced.
The end result is that if one programs the LED using an RGB tuple drawn from sRGB, as from a monitor, that the color will differ substantially. The degree of difference can be read from this figure: The plotted color of the cross is the color of the programmed RGB value, in sRGB space. The difference between the color of a cross and the background sRGB triangle are a depiction of how wrong a programmed color will be. (Remember, the background is strictly true for colors inside the sRGB triangle--those outside of it cannot be represented on a typical monitor.)
Linearity and Gamma
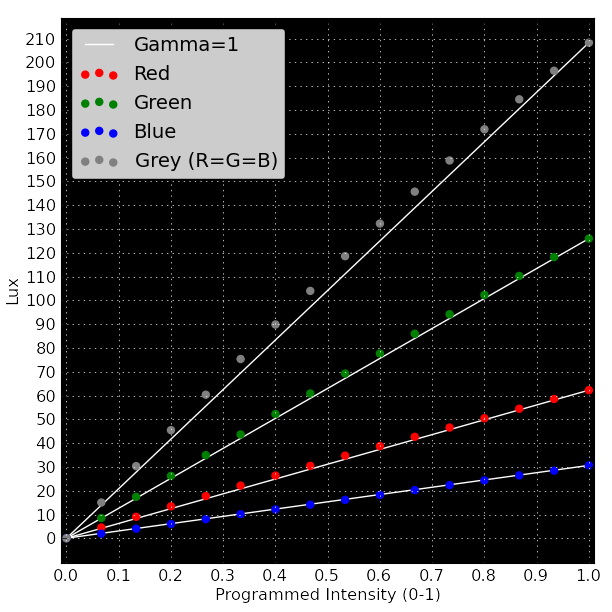
By design, the intensity of each emitter is selected by adjusting the fraction of "on" time during a given time period. LEDs can switch on and off very rapidly, so the length of the "on" pulse should correspond exactly to the intensity of emitted light. That is, the intensity is specified by the duty cycle of the pulses driving the lights. The resulting intensity of the LED should be perfectly linear with respect to the programmed intensity, in the absence of error.
Note that this linear relationship between drive signal and intensity is very different than the perceived brightness. That is, an absolute intensity of 50% does not appear to the eye as half the full brightness. The eye does not evenly distinguish between colors by intensity. The result is that small differences between lower intensities are more significant for the brightness we observe than potentially larger changes in light at higher intensity.
From the perspective of measuring the amount of information recorded (digitally, or in analog form), if one has to limit the total amount, it makes sense to retain greatest precision at intensities where the eye is most discerning, and skimp elsewhere. At intensities most likely to be perceived as bright, or dark, with little differentiation between very near intensities, it is practical to not record tiny differences.
Nearly all computer and movie display formats compensate accordingly. It also happens that many physical media, such as film, or, notably, phosphorus displays, respond similarly. (More explanation, and a few figures are here: http://en.wikipedia.org/wiki/Gamma_compression).
Here, the resulting intensity will be linear with the programmed brightness; it will not have Gamma compression (gamma=1). Programming a fraction of "on" time for the LED will result in exactly that fraction of intensity. It is worth checking whether this ideal circumstance holds true in reality.
Last Modified: 12 Feb 2012